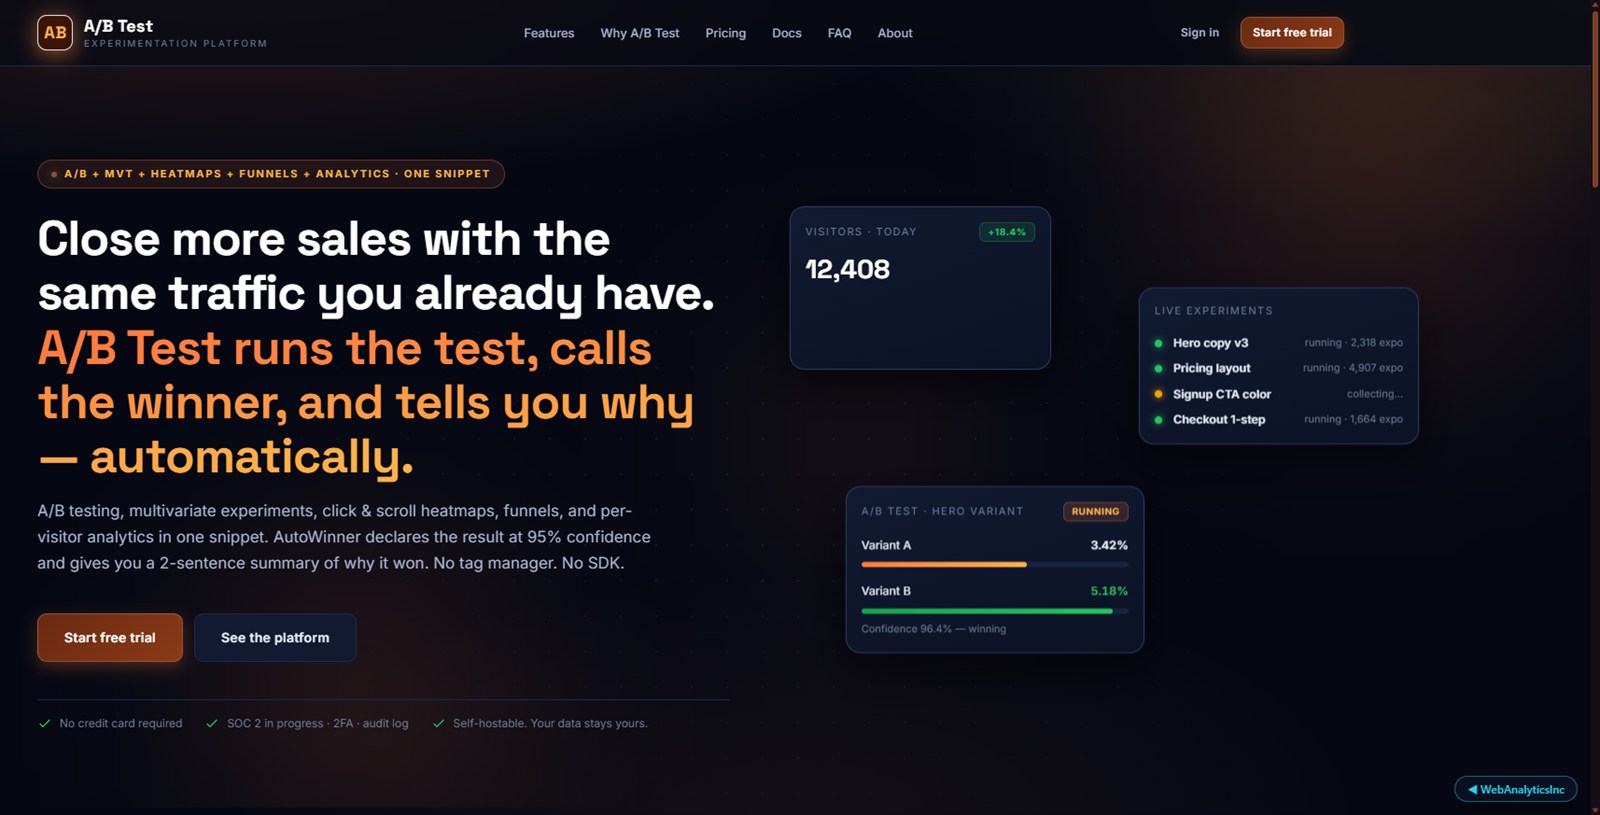
Instant experiments, no code deploy. Scroll maps and click heatmaps. Winner detection with real stats.
See the wins before you commit
A/B, MVT, heatmaps, funnels -- one snippet
Auto-declared winners with confidence intervals
Live visitor + conversion feed on the dashboard
Self-hostable -- your data never leaves your servers
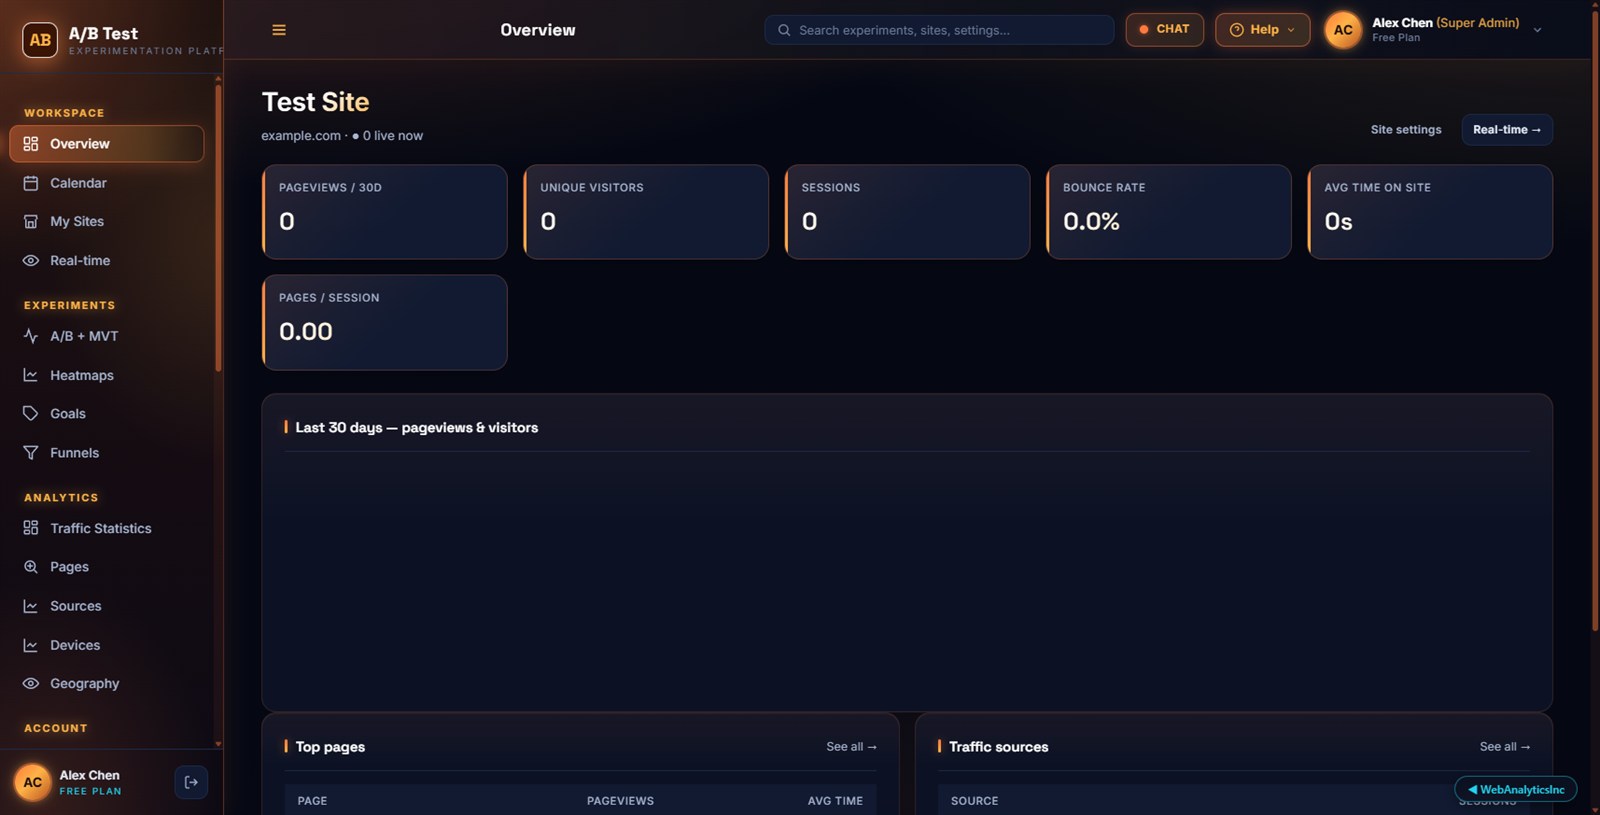
KPI tiles for tests, visitors, conversion
Unread signal badge with counts
30-day trend chart at the top
Click any tile to drill into detail
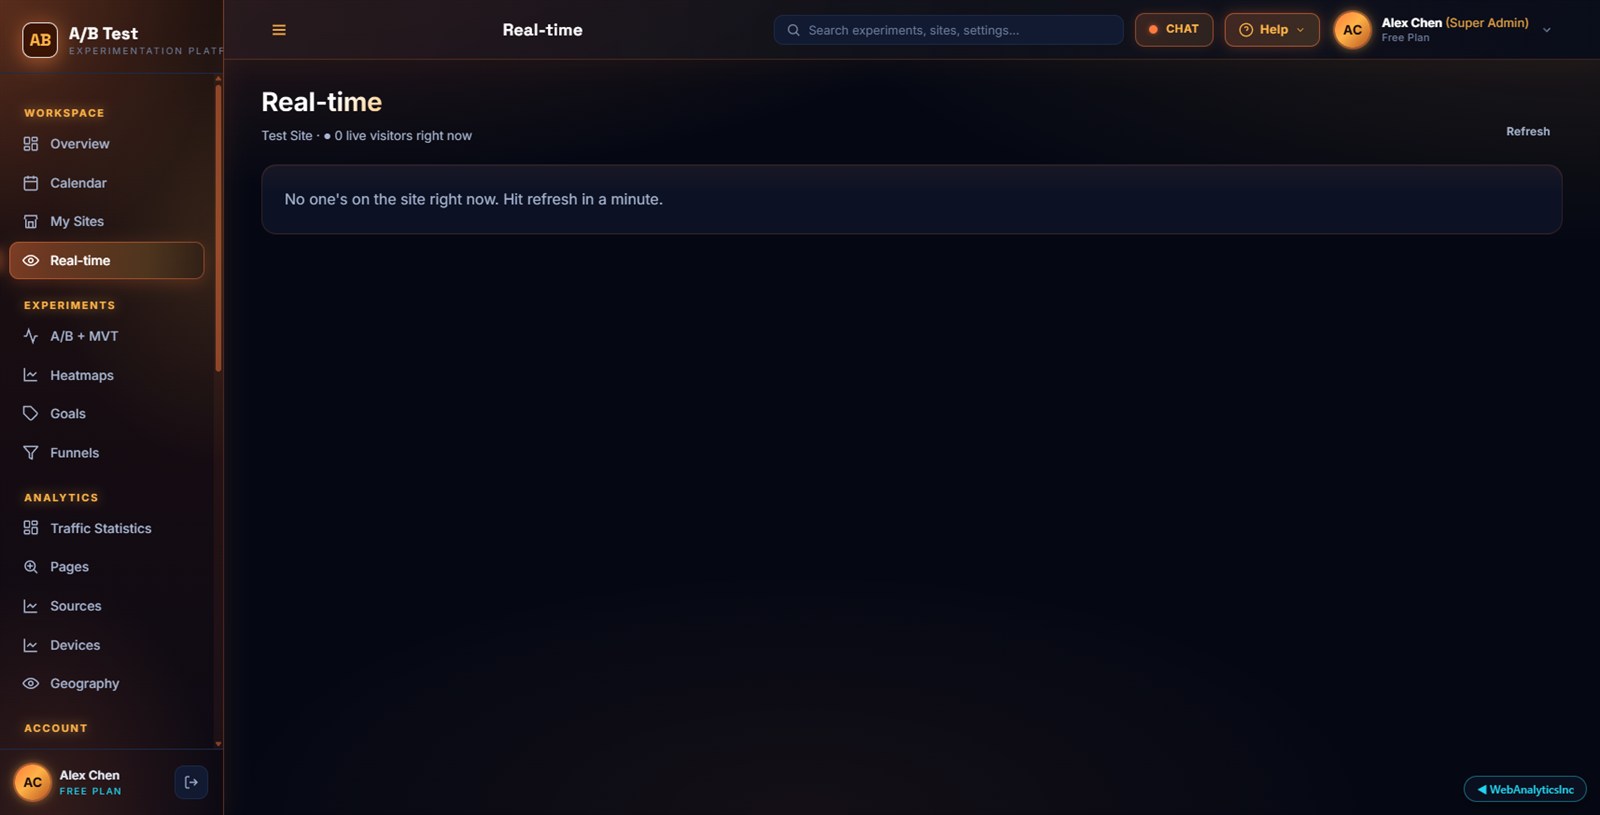
Visitor stream updating every 5 seconds
Active variant assignments live
Live conversion counter per goal
Filter by URL or referrer in real time
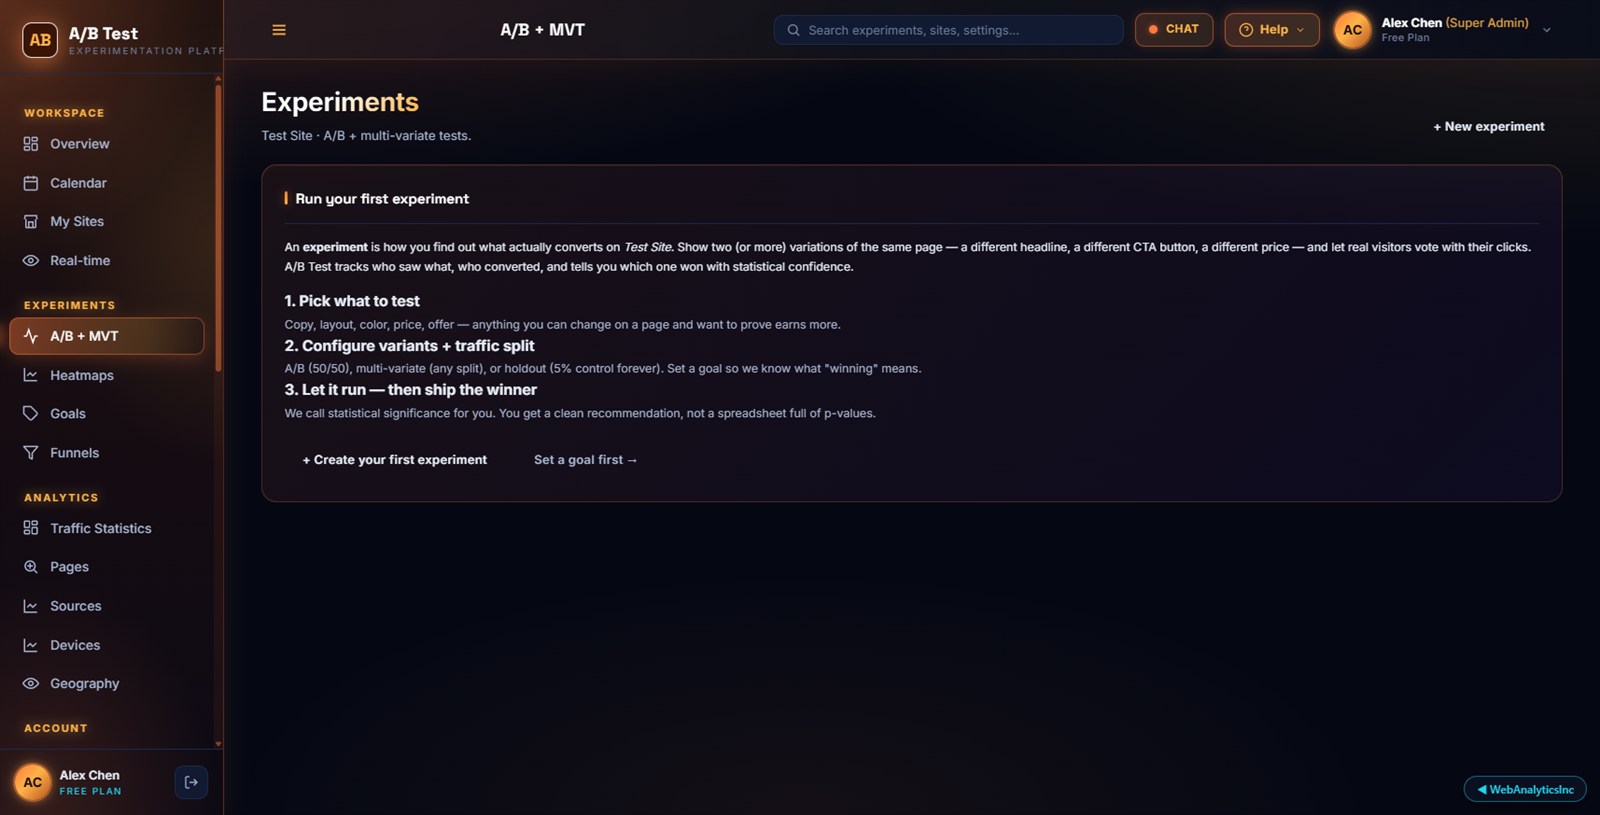
Filter by status, goal, or sample size
Sort by lift, confidence, or visitors
One-click stop, duplicate, or archive
Full export to CSV for reporting
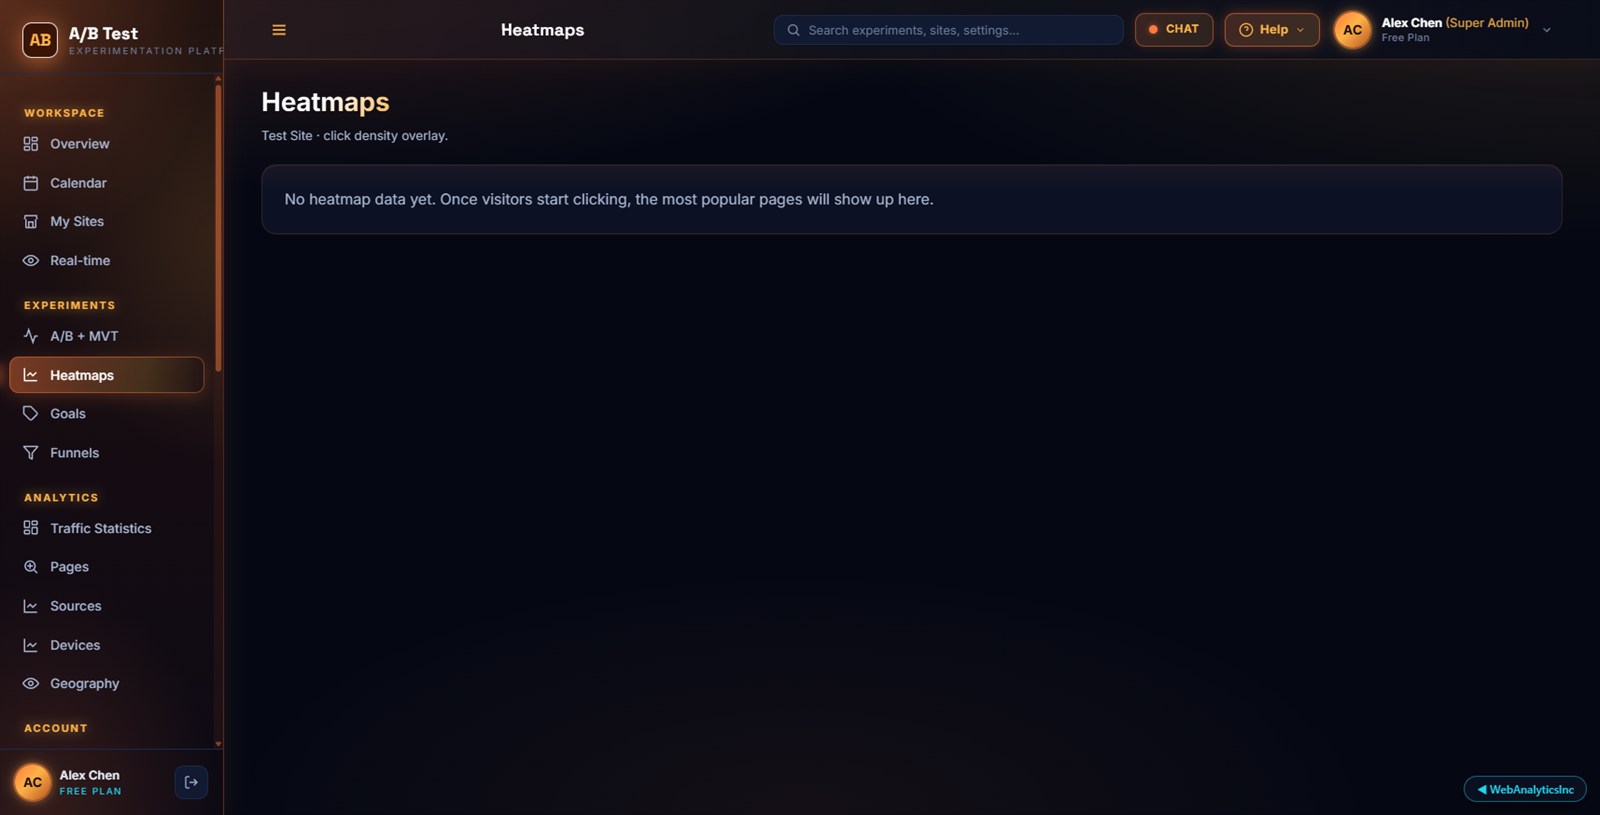
Click density per breakpoint (mobile/tablet/desktop)
Scroll-depth overlays showing fold lines
Inside A/B Test
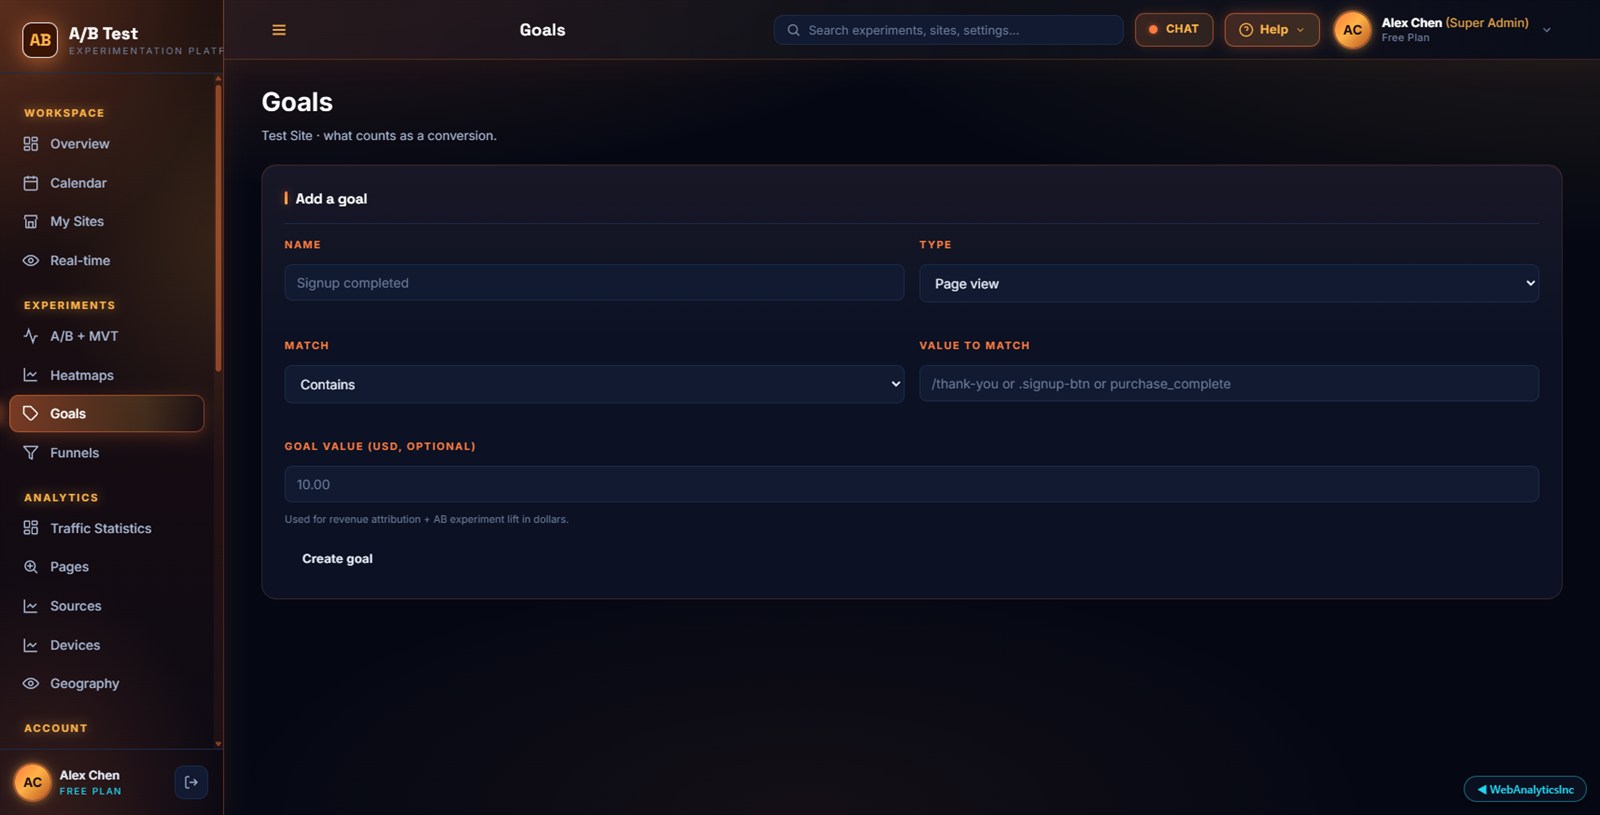
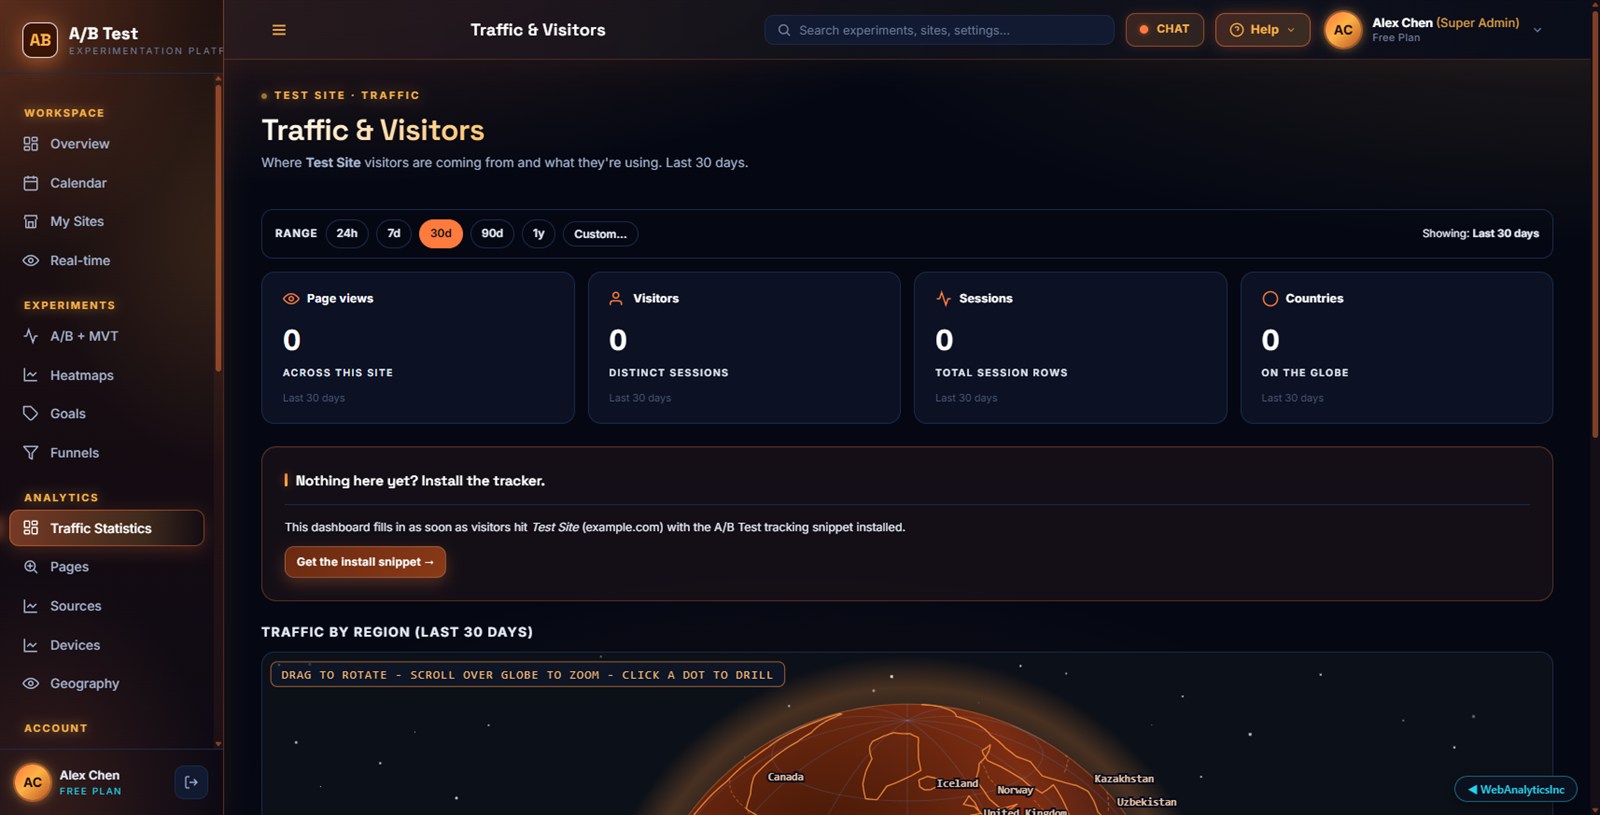
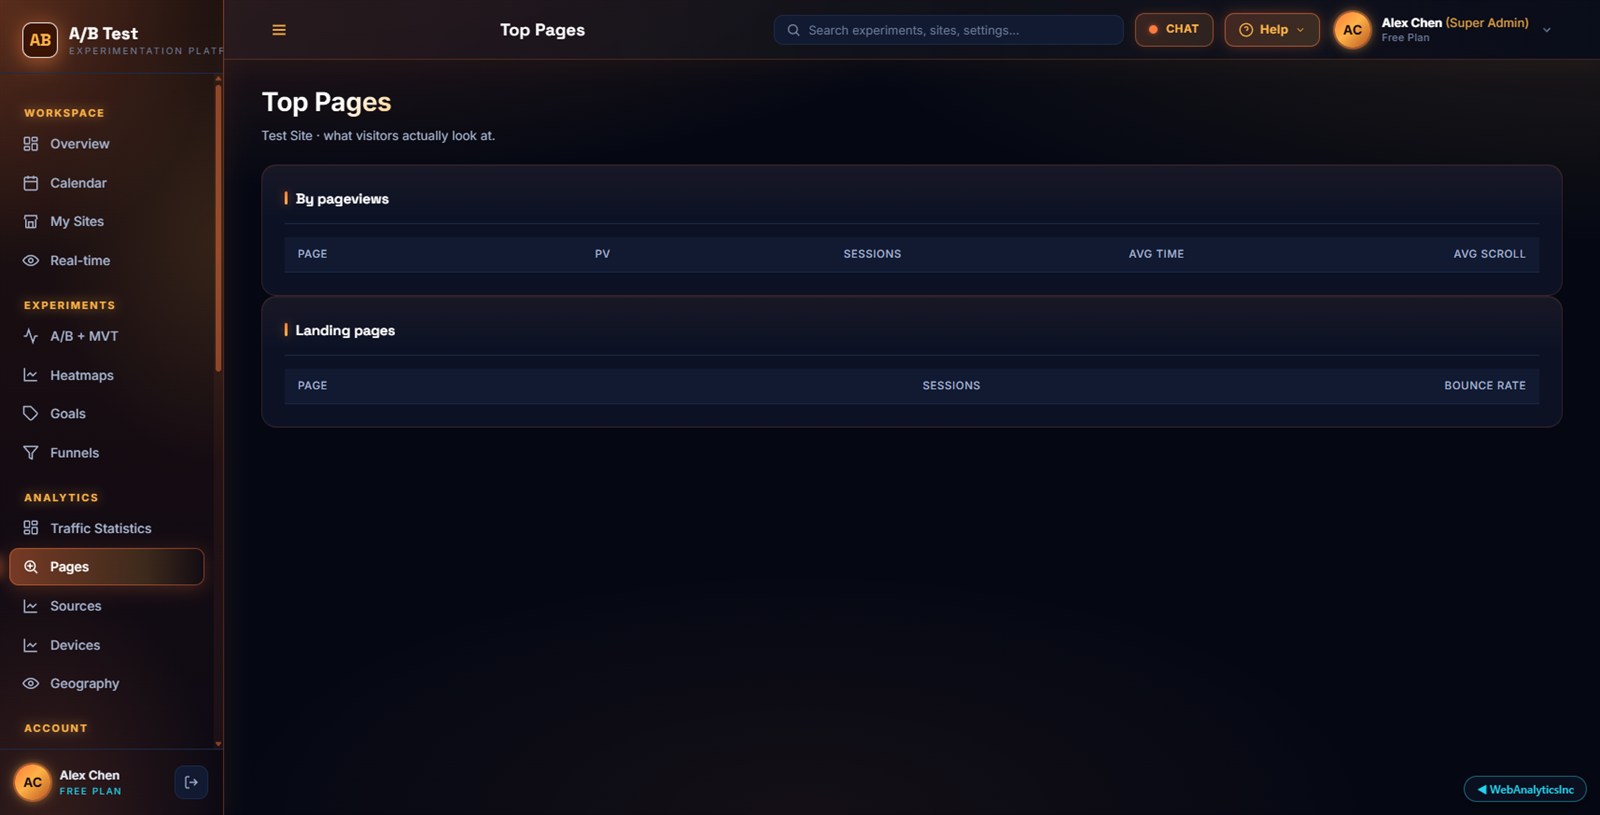
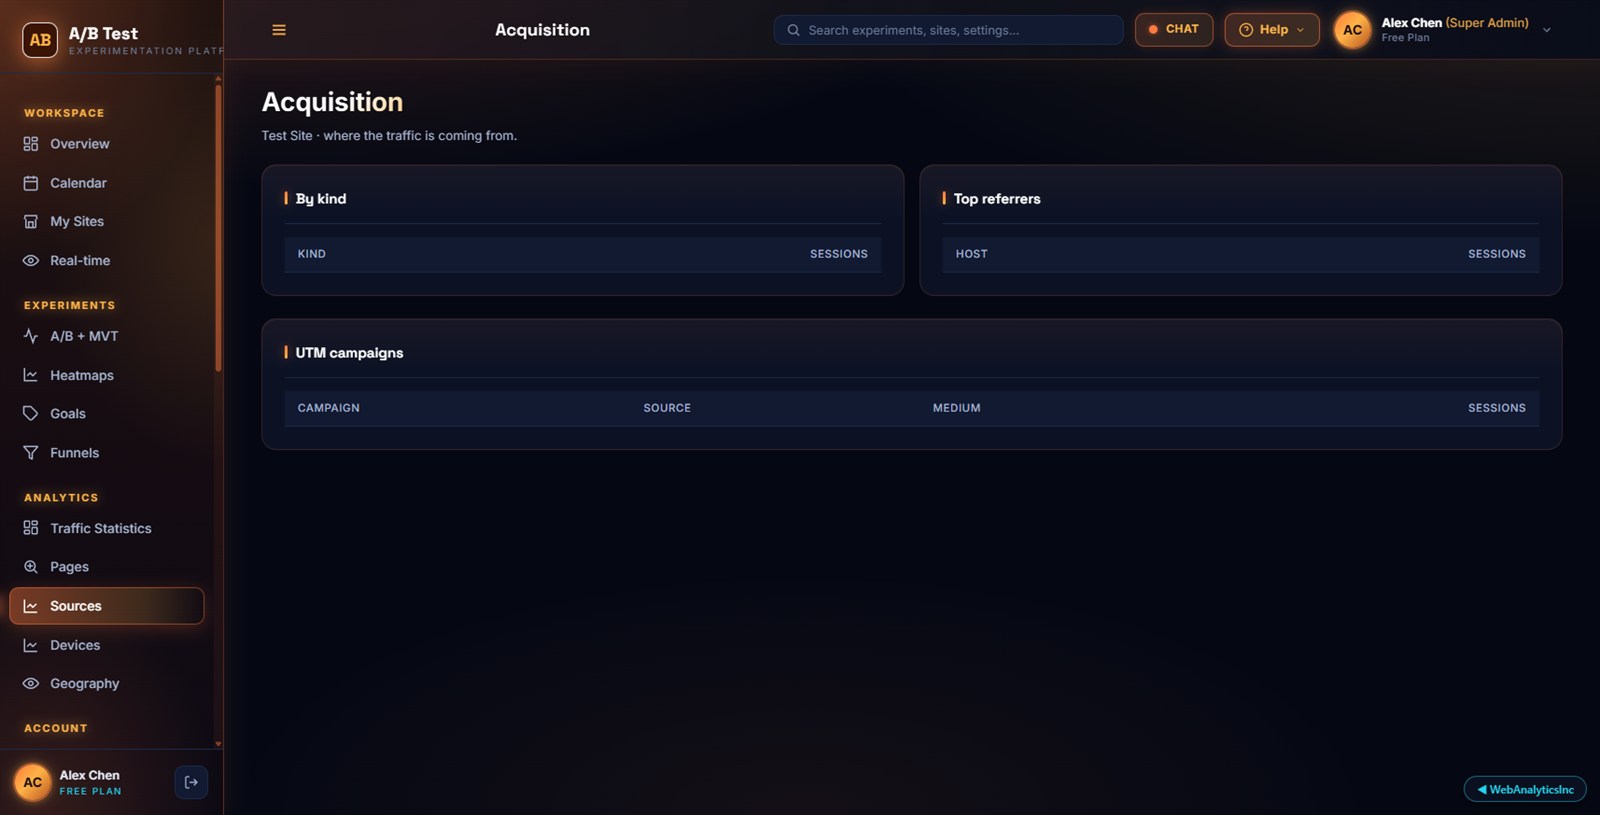
Everything at a glanceLive visitors + live experimentsAll your A/B tests in one listClick + scroll heatmapsGoals that fire on real user eventsWhere visitors drop offAnalytics that outlives cookiesTop pages + entry pointsWhere your traffic comes fromDevice + browser breakdownGeographic distribution